
TL;DR
Meta Ad Metrics fall into two groups. Leading indicators like CTR, CPC, and CPM explain why your ads perform a certain way, while lagging indicators like CPA and ROAS show what results you got. Always check CPA or ROAS first, then use the other numbers to diagnose problems. A high CTR but poor ROAS means the ad works but the offer fails. Low CTR means the creative is weak. High CPM points to expensive audiences. Good ROAS but low volume means you need more scale. The story is simple: focus on sustainable CPA or ROAS, and let the other metrics guide your fixes.
Open Ads Manager, and you’re hit with numbers everywhere. CTR, CPC, CPM, ROAS, CPA, the list keeps growing. For many advertisers, it feels less like data and more like noise. You scroll through the dashboard and wonder which number is worth your attention.
Meta Ad Metrics are the numbers inside Ads Manager that explain both why your ads behave the way they do and what results they bring. The problem is, most advertisers try to track all of them and end up confused.
The truth is, not every metric matters. What you need is a simple way to read the story behind the numbers. Some metrics explain why performance looks a certain way. Others show what the business actually achieved.
In our earlier piece, Understanding Meta Ads, we covered the mindset you need before running ads. This article builds on that foundation by showing you how to separate signal from noise and focus on the numbers that tell the real story.
What Are Leading vs Lagging Indicators?
One of the fastest ways to make sense of Meta Ad Metrics is to split them into two groups: leading indicators and lagging indicators. This simple shift can stop you from drowning in numbers and help you focus on what matters most.
Leading indicators are the early signals that tell you how healthy your ads are. These include:
-
CTR (Click-Through Rate): Shows how many people click after seeing your ad.
-
CPC (Cost Per Click): Tells you how much you pay for each click.
-
CPM (Cost Per Mille): The cost to reach one thousand people in your chosen audience.
These Meta Ads Manager metrics don’t prove business success, but they explain why your ads are performing the way they are. If clicks are low or costs are high, the issue is often with your creative, audience, or message.
Lagging indicators are the result metrics that show the outcome of your campaigns. The key ones are:
-
CPA (Cost Per Acquisition): How much it costs to win a customer.
-
ROAS (Return on Ad Spend): The revenue generated for every dollar spent.
These are the numbers you care about most, because they prove whether your ads are delivering sustainable growth.
Many advertisers confuse the two. They panic when CTR dips, even though ROAS is strong. Or they celebrate a high CTR while ignoring that ROAS is weak. Both mistakes lead to poor decisions. The right way is to check lagging indicators first, then use leading indicators to diagnose the reasons behind them.
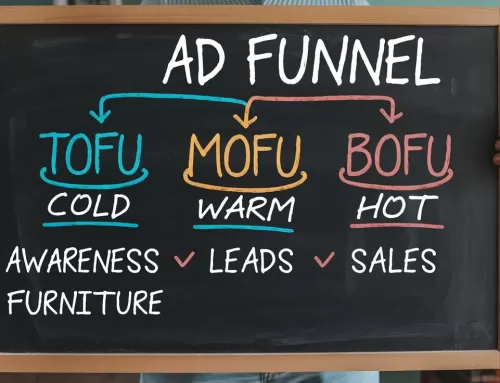
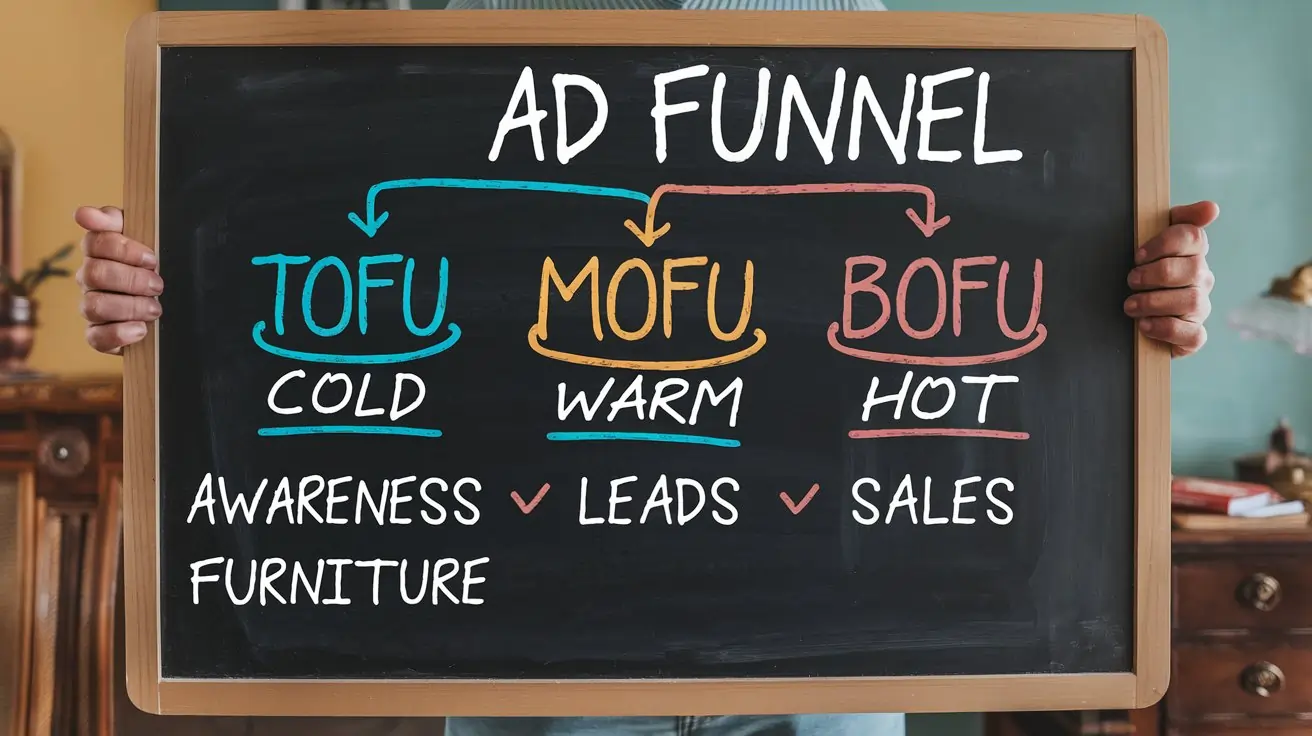
Your funnel stage also plays a role. In How to Build a Meta Ads Funnel That Converts, we showed how awareness ads behave differently from conversion ads. The metrics you watch will shift with each stage of that funnel.
For more details on how Meta reports these numbers, see Meta’s official guide on Ads Reporting. The key is simple: leading tells you why, lagging tells you what. Always read Meta Ad Metrics in context, not in isolation.
How Do You Read the Story in Meta Ad Metrics?
Every number in Ads Manager plays a role in a bigger story. Some metrics act like early hints, while others are the final chapter. When you connect them, you can spot where things go wrong and where they are working.
Think of it like this: lagging indicators (CPA, ROAS) tell you the ending of the story. Leading indicators (CTR, CPC, CPM) explain how you got there. If the ending looks bad, the early clues help you figure out why.
Here are four common scenarios and the stories they tell:
-
Scenario A: High CTR, bad ROAS
Story: The ad grabs attention, but people don’t buy once they click. This means the creative is strong, but the landing page, pricing, or offer is failing to convert.
Fix: Review the page experience and tighten the offer before spending more. -
Scenario B: Low CTR
Story: Very few people click, which means the creative and copy are not resonating with the audience. The hook is weak.
Fix: Test new angles, stronger headlines, or fresh visuals. Even small changes can lift CTR. -
Scenario C: High CPM
Story: You are paying a high price just to reach people. That usually means the audience is expensive or highly competitive.
Fix: Expand the audience, refine targeting, or test different placements. Platform choice also matters — CPM and CPC can vary between networks, as explained in The Truth About Google Ads vs Facebook Ads. -
Scenario D: Great ROAS, but low volume
Story: The ads are profitable, but you are not getting enough scale. This happens when targeting is too narrow or budgets are capped.
Fix: Broaden the audience, raise spend gradually, or add new creative variations to reach more people.
These stories repeat across campaigns. Each one shows how leading indicators point to the cause behind lagging results. The mistake is to treat Meta Ad Metrics in isolation. When you read them together, you see the full picture.
The real skill is diagnosis. You don’t stop at “CTR is low” or “ROAS is bad.” You ask what the story is behind those numbers. That shift changes the way you troubleshoot. Instead of guessing, you follow the clues. And once you see the story, you know exactly where to act.
The Metric That Truly Matters in Meta Ad Metrics
When you look at Meta Ad Metrics, it’s easy to get distracted by every number on the screen. CTR, CPC, and CPM matter, but they don’t decide if your ads are truly working. The ultimate test of success comes down to two numbers: CPA (Cost Per Acquisition) and ROAS (Return on Ad Spend).
These are the business metrics. CPA tells you how much it costs to win a customer. ROAS tells you how much revenue you generate for every dollar you spend. Together, they answer the only question that matters: is this campaign profitable and sustainable for the business?
The other Meta Ads Manager metrics are still important, but only as supporting signals. A low CTR can warn you that creative is weak. A high CPM can show that your audience is competitive. These clues help you diagnose why your CPA or ROAS looks good or bad. But on their own, they don’t mean much.
This is where many advertisers get lost. They celebrate a high CTR without realizing their ROAS is negative. Or they panic about a high CPM even though their CPA is efficient. The story can only be read correctly when you place the supporting metrics in context with CPA and ROAS.
Benchmarks can also help you understand if your numbers are in line with industry averages. According to WordStream’s PPC Benchmarks, average CTR, CPC, and conversion rates vary widely by sector. Knowing these ranges can stop you from chasing unrealistic goals or worrying about numbers that are normal for your industry.
The rule is simple: check CPA and ROAS first. If they look healthy, your ads are on track. If not, use the other metrics to diagnose why. Everything else is just a supporting actor in the bigger story.
Key Takeaways
Meta Ad Metrics only make sense when you know what role each number plays. Leading indicators such as CTR, CPC, and CPM explain why your ads perform the way they do. Lagging indicators like CPA and ROAS show what business results you actually achieved.
The scenarios we covered prove that every number tells part of the story. A high CTR but poor ROAS points to problems with your offer or landing page. Low CTR highlights weak creative. High CPM signals expensive audiences. Strong ROAS but low volume shows you need more scale. Each case is a diagnosis, not just a random figure on a dashboard.
The lesson is simple: success is measured by sustainable CPA or ROAS. The other Meta Ad Metrics are valuable only because they explain why those final numbers look the way they do. Read them as a story, not in isolation.
FAQ
What’s the difference between CPC and CPM?
CPC (Cost Per Click) is what you pay each time someone clicks on your ad. CPM (Cost Per Mille) is the cost to show your ad to one thousand people, whether they click or not. CPC measures engagement, while CPM measures the cost of reach.
Which metric matters in the first week of a campaign?
In the early days, focus on leading indicators such as CTR, CPC, and CPM. These Meta Ads Manager metrics show if your creative and targeting are working before you have enough purchase data to judge CPA or ROAS. Once results build up, shift your focus to lagging indicators.
Can a high CTR still mean a losing campaign?
Yes. A strong CTR only proves your ad grabs attention. If ROAS is weak, the landing page or offer is not converting those clicks into customers. High engagement without sales means the campaign is failing, even though CTR looks good.
How do I know if my CPM is too high?
Compare your CPM against industry averages. Some audiences, like finance or software, will naturally cost more. If CPM is high across all audiences, your targeting may be too narrow or too competitive.
What’s more important: CPA or ROAS?
Both matter, but CPA tells you if you can afford to keep acquiring customers, while ROAS shows if the campaign generates enough revenue. Together, they reveal if your ads are truly sustainable.


